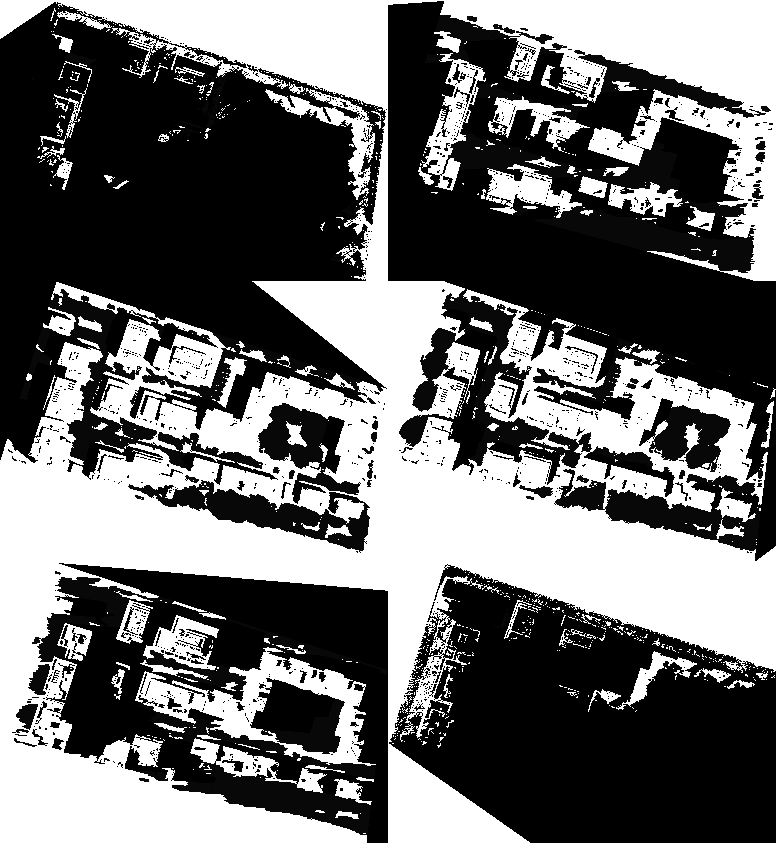
Cookbook for Solar Cadastre using QGIS and OSM Data
Recently in class we used QGIS to create some useful Solar Cadastre pictures for analysis of solar resources. I used a combination of OSM data and data from data.grandlyon.fr for digital terrain model and a digital surface model to create the analyses. It was super interesting, because with just a little investment of time, and publicly available resources, I was able to create really neat looking reports on all kinds of solar availability metrics like sky view factor, sun hours, and sun-path animations.
Assumptions:
- Using QGIS 4.2
- Add-ons required:
- UMEP
- UMEP for Processing
- QuickOSM
Cookbook
Workflow 1.1: OSM data extraction
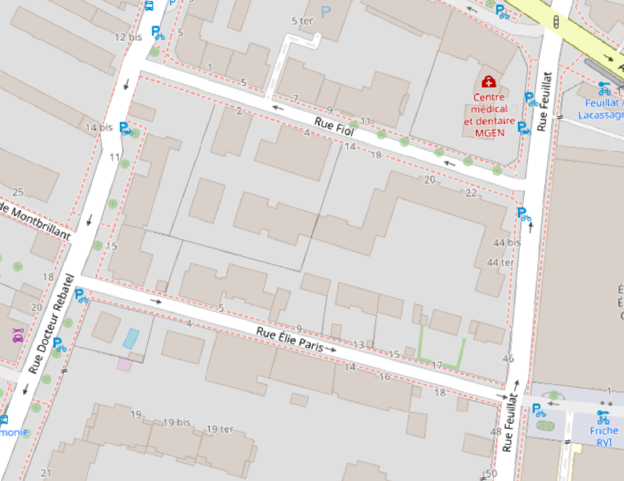
- Bring in OSM as a XYZ layer. Hopefully there is already building vector data for the area of interest. You should ideally see something like Figure 1.
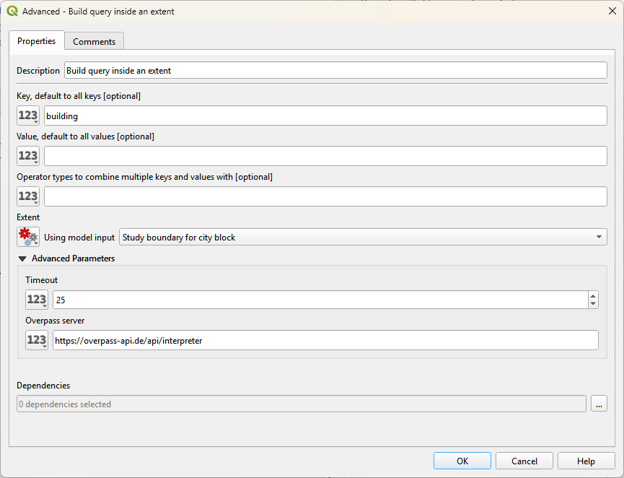
- Build a query inside an extent using your Study boundary for city block vector layer. This query will contact the overpass-api server to request OSM data.
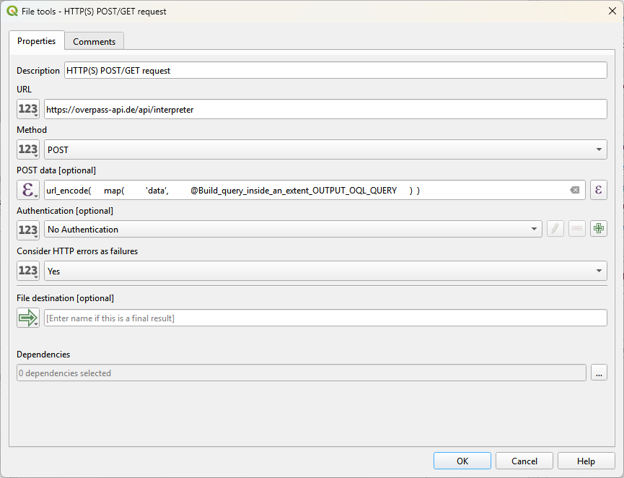
- Next create a HTTP(S) POST/GET request using the same overpass-api.de URL. Use the POST method and input the code given below:
url_encode(
    map(
        'data',
        @Build_query_inside_an_extent_OUTPUT_OQL_QUERY
    )
)
The other resulting request options looked like Figure 3 for me.
- Then using QuickOSM, open the sublayers from the OSM file that the HTTP(S) POST/GET request returns and save the vector features to file, then extract by location, using the Study boundary for city block as the comparison layer. I had to re-project the layer, since I had not already re-projected the XYZ OSM file.
Tangent - turns out the CLI utility ffmpeg does not support 32 bit, single band (in this color just the channel for gray) image, or the kind of images that this QGIS project produced.